小智报表分发包嵌入
小智报表是一款纯原生js 构建的智能电子表格,旨在帮助产品高效解决报表问题。
1.展示端SDK的获取与嵌入
访问全局变量 window.XZReport。可将开发者平台创建的报表展示出来。
1.1 SDK获取
联系小智获取试用专属开发包
1.2 SDK资源文件说明
核心库 sheet-core
报表的核心文件,不管是展示端和设计器都需要引入
ui库 sheet-ui
报表的UI组件库,不管是展示端和设计器都需要引入
数据处理库 data-handler
报表的数据处理需要用到的。展示端需要,设计器不需要
参数面板库 params-panel
参数面板相关的,如果用到了参数查询等,展示端和设计器都需要引入。不需要的话,可以不引入
excel库 excel-io
excel 导入导出功能 如果使用到了相关功能。就需要引入
公式库 formula
公式相关 如果用到了相关功能,就需要引入
打印库 print
打印和pdf导出功能相关的库 如果使用到了此功能。展示端需要引入
条形码库 barcode
条形码相关功能,如果用到了,需要引入
二维码库 qrcode
二维码相关的库,如果用到了,需要引入
图表库 chart
图表功能相关的库,如果用到了,需要引入
1.3 嵌入
因为是原生js构建,所以说和框架无关。可以在vue ,react等任意框架中使用。
需要引入核心包sheet-core.js , 可访问全局变量 window.XZReport。小智报表展示端需要一个dom元素来实现初始化,小智报表在初始化方法中有一个option字段,我们通过该option字段来对设计器进行参数设置,其它更多的参数请查看注释里的说明。
初始化之前,我们需要先准备一些控件属性、数据和报表配置 (以json数据为例)
const options = {
  view: {
    width: () => document.documentElement.clientWidth,  //设置宽度  function 返回值为number
    height: () => document.documentElement.clientHeight //设置高度  function 返回值为number
  },
  renderArrow:false,  // 是否显式 扩展方向图标
  showFreeze:false,  // 是否显式冻结线
  showGrid:false   // 是否显式网格线
};
// 现在报表里数据配置分为2种 type 1 json数据  3API服务
// API服务的配置是已经存在报表配置信息中的
// json 数据需要使用 update方法更新
const data = [{
  name: "test",
  response_data: [{
    "商品": "A产品",
    "季度": 1,
    "销售额": 5890.56
  }, {
    "商品": "A产品",
    "季度": 2,
    "销售额": 4566.26
  }, {
    "商品": "A产品",
    "季度": 3,
    "销售额": 7861.56
  }, {
    "商品": "A产品",
    "季度": 4,
    "销售额": 5654.56
  }, {
    "商品": "A产品",
    "季度": 1,
    "销售额": 5820.96
  }, {
    "商品": "A产品",
    "季度": 2,
    "销售额": 5666.26
  }, {
    "商品": "A产品",
    "季度": 3,
    "销售额": 8661.56
  }, {
    "商品": "A产品",
    "季度": 4,
    "销售额": 5254.56
  }, {
    "商品": "B产品",
    "季度": 1,
    "销售额": 5890.56
  }, {
    "商品": "B产品",
    "季度": 2,
    "销售额": 4456.16
  }, {
    "商品": "B产品",
    "季度": 3,
    "销售额": 7561.56
  }, {
    "商品": "B产品",
    "季度": 4,
    "销售额": 3554.56
  }, {
    "商品": "B产品",
    "季度": 1,
    "销售额": 4620.96
  }, {
    "商品": "B产品",
    "季度": 2,
    "销售额": 5456.26
  }, {
    "商品": "B产品",
    "季度": 3,
    "销售额": 8891.56
  }, {
    "商品": "B产品",
    "季度": 4,
    "销售额": 5623
  }, {
    "商品": "C产品",
    "季度": 1,
    "销售额": 4600.78
  }, {
    "商品": "C产品",
    "季度": 2,
    "销售额": 5246
  }, {
    "商品": "C产品",
    "季度": 3,
    "销售额": 7761.56
  }, {
    "商品": "C产品",
    "季度": 4,
    "销售额": 8164
  }, {
    "商品": "C产品",
    "季度": 1,
    "销售额": 4645.56
  }, {
    "商品": "C产品",
    "季度": 2,
    "销售额": 6579
  }, {
    "商品": "C产品",
    "季度": 3,
    "销售额": 7591.56
  }, {
    "商品": "C产品",
    "季度": 4,
    "销售额": 7168
  }, {
    "商品": "D产品",
    "季度": 1,
    "销售额": 4678.56
  }, {
    "商品": "D产品",
    "季度": 2,
    "销售额": 6659
  }, {
    "商品": "D产品",
    "季度": 3,
    "销售额": 7567.56
  }, {
    "商品": "D产品",
    "季度": 4,
    "销售额": 7498
  }, {
    "商品": "D产品",
    "季度": 1,
    "销售额": 5246
  }, {
    "商品": "D产品",
    "季度": 2,
    "销售额": 4645
  }, {
    "商品": "D产品",
    "季度": 3,
    "销售额": 7561.8
  }, {
    "商品": "D产品",
    "季度": 4,
    "销售额": 7941
  }],
  type:1     // 1 json 数据    3 api服务
}]
// 注意!需要使用开发者平台设计器导出的配置json才会生效
const sheetConfig = [{
    "name": "sheet1",
    "SheetData": {
        "freeze": "A1",
        "columnHead": [{
            "Column": 0
        }, {
            "Column": 1
        }, {
            "Column": 2
        }],
        "rowHead": [{
            "Row": 0
        }, {
            "Row": 1
        }, {
            "Row": 2
        }],
        "dataConfig":[],
        "apiConfig":[],
        "paramsConfig":[],
        "stylesConfig": [{
            "border": {
                "bottom": ["thin", "#666"],
                "top": ["thin", "#666"],
                "left": ["thin", "#666"],
                "right": ["thin", "#666"]
            }
        }, {
            "align": "center",
            "valign": "middle"
        }, {
            "border": {
                "bottom": ["thin", "#666"],
                "top": ["thin", "#666"],
                "left": ["thin", "#666"],
                "right": ["thin", "#666"]
            },
            "align": "center"
        }, {
            "align": "center"
        }, {
            "align": "center",
            "valign": "middle",
            "border": {
                "bottom": ["thin", "#666"],
                "top": ["thin", "#666"],
                "left": ["thin", "#666"],
                "right": ["thin", "#666"]
            }
        }, {
            "border": {
                "bottom": ["thin", "#666"],
                "top": ["thin", "#666"],
                "left": ["thin", "#666"],
                "right": ["thin", "#666"]
            },
            "align": "left"
        }, {
            "border": {
                "bottom": ["thin", "#666"],
                "top": ["thin", "#666"],
                "left": ["thin", "#666"],
                "right": ["thin", "#666"]
            },
            "align": "center",
            "bgcolor": "#01B0F1"
        }, {
            "border": {
                "bottom": ["thin", "#666"],
                "top": ["thin", "#666"],
                "left": ["thin", "#666"],
                "right": ["thin", "#666"]
            },
            "align": "center",
            "bgcolor": "#93D051"
        }, {
            "border": {
                "bottom": ["thin", "#666"],
                "top": ["thin", "#666"],
                "left": ["thin", "#666"],
                "right": ["thin", "#666"]
            },
            "align": "center",
            "bgcolor": "#FFC001"
        }],
        "cellConfig": [{
            "column": 0,
            "row": 0,
            "value": "",
            "styleIndex": 5,
            "editable": true,
            "slash": {
                "text": "商品|季度",
                "type": 0,
                "lineStyle": "thin",
                "lineColor": "#000"
            },
            "dataConfig": {}
        }, {
            "column": 1,
            "row": 0,
            "value": "test.商品",
            "valueType": 1,
            "expansion": 2,
            "styleIndex": 2,
            "editable": false,
            "scaleType": 1,
            "dataConfig": {
                "value": "test.商品",
                "data_type": "3",
                "merge": 1,
                "axisType": 1,
                "order": 0
            },
            "type": 2,
            "dataType": "3"
        }, {
            "column": 2,
            "row": 0,
            "value": "合计",
            "styleIndex": 6,
            "type": 6
        }, {
            "column": 0,
            "row": 1,
            "value": "test.季度",
            "valueType": 1,
            "expansion": 1,
            "styleIndex": 2,
            "editable": false,
            "scaleType": 1,
            "dataConfig": {
                "value": "test.季度",
                "data_type": "2",
                "axisType": 1,
                "order": 0,
                "merge": 1
            },
            "type": 2,
            "dataType": "2"
        }, {
            "column": 1,
            "row": 1,
            "value": "test.销售额",
            "valueType": 1,
            "expansion": 3,
            "styleIndex": 2,
            "editable": false,
            "scaleType": 1,
            "dataConfig": {
                "value": "test.销售额",
                "data_type": "2",
                "aggregate": 1,
                "axisType": 2,
                "order": 0
            },
            "type": 2,
            "dataType": "2"
        }, {
            "column": 2,
            "row": 1,
            "value": "=SUM(B2)",
            "styleIndex": 6,
            "type": 5
        }, {
            "column": 0,
            "row": 2,
            "value": "合计",
            "styleIndex": 7,
            "type": 6
        }, {
            "column": 1,
            "row": 2,
            "value": "=SUM(B2)",
            "styleIndex": 7,
            "warn": [{
                "name": "条件1",
                "act_on": 1,
                "cond_str": "((字段:test.商品) 不为空 )",
                "filter": {
                    "logic": 1,
                    "params": [{
                        "logic": 1,
                        "params": [{
                            "column": "0:1",
                            "data_type": 3,
                            "logic": 1,
                            "type": 8,
                            "value": "",
                            "cname": "test.商品",
                            "is_req": false
                        }]
                    }]
                },
                "style_str": "小数位:2位; ",
                "stylesConfig": {
                    "format": {
                        "decimal": 2
                    }
                }
            }],
            "type": 5
        }, {
            "column": 2,
            "row": 2,
            "value": "=SUM(B2)",
            "styleIndex": 8,
            "warn": [{
                "name": "条件1",
                "act_on": 1,
                "cond_str": "((字段:test.商品) 不为空 )",
                "filter": {
                    "logic": 1,
                    "params": [{
                        "logic": 1,
                        "params": [{
                            "column": "0:1",
                            "data_type": 3,
                            "logic": 1,
                            "type": 8,
                            "value": "",
                            "cname": "test.商品",
                            "is_req": false
                        }]
                    }]
                },
                "style_str": "小数位:2位; ",
                "stylesConfig": {
                    "format": {
                        "decimal": 2
                    }
                }
            }],
            "type": 5
        }],
        "groupConfig": [{
            "label": "A1-C3",
            "children": [{
                "label": "A2-C3",
                "children": [{
                    "label": "A2-B3",
                    "borderColor": "rgba(255, 115, 191)",
                    "bgColor": "rgba(255, 115, 191,0.5)",
                    "noagg": false,
                    "no_agg": false,
                    "repeat": {
                        "isRepeat": false,
                        "repeatKey": "",
                        "repeatValue": ""
                    },
                    "position": "A2:B3"
                }],
                "borderColor": "rgba(115, 187, 255)",
                "bgColor": "rgba(115, 187, 255,0.5)",
                "noagg": false,
                "no_agg": false,
                "repeat": {
                    "isRepeat": false,
                    "repeatKey": "",
                    "repeatValue": ""
                },
                "position": "A2:C3"
            }],
            "borderColor": "rgba(94, 255, 215)",
            "bgColor": "rgba(94, 255, 215,0.5)",
            "noagg": false,
            "no_agg": false,
            "repeat": {
                "isRepeat": false,
                "repeatKey": "",
                "repeatValue": ""
            },
            "position": "A1:C3"
        }],
        "collapse": [],
        "toolbarButtonList": [{
            "showIcon": true,
            "showText": true,
            "text": "首页",
            "icon": "fa fa-step-backward",
            "color": "#2c3e50",
            "show": true,
            "type": 1
        }, {
            "showIcon": true,
            "showText": true,
            "text": "上一页",
            "icon": "xzreport-icon-arrow-left-filling",
            "color": "#2c3e50",
            "show": true,
            "type": 2
        }, {
            "showIcon": true,
            "showText": true,
            "text": "当前页/总页数",
            "icon": "",
            "color": "#2c3e50",
            "show": true,
            "type": 3
        }, {
            "showIcon": true,
            "showText": true,
            "text": "下一页",
            "icon": "xzreport-icon-arrow-right-filling",
            "color": "#2c3e50",
            "show": true,
            "type": 4
        }, {
            "showIcon": true,
            "showText": true,
            "text": "末页",
            "icon": "fa fa-step-forward",
            "color": "#2c3e50",
            "show": true,
            "type": 5
        }, {
            "showIcon": true,
            "showText": true,
            "text": "打印",
            "color": "#2c3e50",
            "icon": "fa fa-print",
            "show": true,
            "type": 6
        }, {
            "showIcon": true,
            "showText": true,
            "text": "导出",
            "icon": "fa fa-download",
            "color": "#2c3e50",
            "show": true,
            "type": 7
        }]
    }
}]
原生js嵌入示例
<div id="chartContainer"></div>
// 需要注意引入文件的顺序
// 引入ui
import "/xzSpreadsheet/sheet-ui/sheet-ui.css"
import "/xzSpreadsheet/sheet-ui/sheet-ui.js"
// 引入公式
import "/xzSpreadsheet/formula/formula.js"
// excel
import "/xzSpreadsheet/excel-io/excel-io.js"
// 参数面板
import "/xzSpreadsheet/params-panel/params-panel.css"
import "/xzSpreadsheet/params-panel/params-panel.js"
// qrcode
import "/xzSpreadsheet/qrcode/qrcode.js"
// 条形码
import "/xzSpreadsheet/barcode/barcode.js"
// 数据处理
import "/xzSpreadsheet/data-handler/data-handler.js"
// 打印
import "/xzSpreadsheet/print/print.js"

// 引入图表
import "/xzSpreadsheet/chart/chart.css"
import "/xzSpreadsheet/chart/chart.js"

// 核心库
import "/xzSpreadsheet/sheet-core/sheet-core.css"
import "/xzSpreadsheet/sheet-core/sheet-core.js"

// options控件的配置项  sheetConfig 报表信息   data数据
const sheet = XZReport("#container", options);
// 需要使用 update 方法更新报表 sheetConfig  报表配置,data 数据配置
spreadSheet.update(sheetConfig,data)
Vue嵌入示例 ( 以vue 3 为例 )
<template>
  <div id="container" style="width: 100%; height: 100%"></div>
</template>

<script setup>
import { ref, onMounted } from 'vue';
// 需要注意引入文件的顺序
// 引入ui
import "@/assets/xzSpreadsheet/sheet-ui/sheet-ui.css"
import "@/assets/xzSpreadsheet/sheet-ui/sheet-ui.js"
// 引入公式
import "@/assets/xzSpreadsheet/formula/formula.js"
// excel
import "@/assets/xzSpreadsheet/excel-io/excel-io.js"
// 参数面板
import "@/assets/xzSpreadsheet/params-panel/params-panel.css"
import "@/assets/xzSpreadsheet/params-panel/params-panel.js"
// qrcode
import "@/assets/xzSpreadsheet/qrcode/qrcode.js"
// 条形码
import "@/assets/xzSpreadsheet/barcode/barcode.js"
// 数据处理
import "@/assets/xzSpreadsheet/data-handler/data-handler.js"
// 打印
import "@/assets/xzSpreadsheet/print/print.js"

// 引入图表
import "@/assets/xzSpreadsheet/chart/chart.css"
import "@/assets/xzSpreadsheet/chart/chart.js"

// 核心库
import "@/assets/xzSpreadsheet/sheet-core/sheet-core.css"
import "@/assets/xzSpreadsheet/sheet-core/sheet-core.js"
let sheet = null;
onMounted( () => {
  sheet =  XZReport("#container", options);
  // 需要使用 update 方法更新报表 sheetConfig  报表配置,data 数据配置
  spreadSheet.update(sheetConfig,data)
});
React嵌入示例 ( 以React 16 为例)
import React, { useEffect } from 'react';
// 需要注意引入文件的顺序
// 引入ui
import "@/assets/xzSpreadsheet/sheet-ui/sheet-ui.css"
import "@/assets/xzSpreadsheet/sheet-ui/sheet-ui.js"
// 引入公式
import "@/assets/xzSpreadsheet/formula/formula.js"
// excel
import "@/assets/xzSpreadsheet/excel-io/excel-io.js"
// 参数面板
import "@/assets/xzSpreadsheet/params-panel/params-panel.css"
import "@/assets/xzSpreadsheet/params-panel/params-panel.js"
// qrcode
import "@/assets/xzSpreadsheet/qrcode/qrcode.js"
// 条形码
import "@/assets/xzSpreadsheet/barcode/barcode.js"
// 数据处理
import "@/assets/xzSpreadsheet/data-handler/data-handler.js"
// 打印
import "@/assets/xzSpreadsheet/print/print.js"

// 引入图表
import "@/assets/xzSpreadsheet/chart/chart.css"
import "@/assets/xzSpreadsheet/chart/chart.js"

// 核心库
import "@/assets/xzSpreadsheet/sheet-core/sheet-core.css"
import "@/assets/xzSpreadsheet/sheet-core/sheet-core.js"

const example = props => {
  let sheet = null;

  useEffect(() => {
    sheet =  XZReport("#container", options);
     // 需要使用 update 方法更新报表 sheetConfig  报表配置,data 数据配置
    spreadSheet.update(sheetConfig,data)
  }, []);

  return (
    <div id="container" ></div>
  );
}
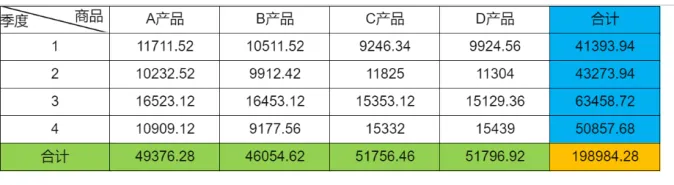
2. 数据的使用
当报表中使用了 JSON 数据集时,在预览阶段需用真实数据替换预设数据。可通过调用update方法传入实际数据
注意事项:
response_data 支持以下两种数据格式 格式一:列名 + 数据数组 格式二:对象数组
- 数据配置中传入的数据结构应为:
json
  [
    {
      "name": "数据表名称",
      "response_data":{
          "columns": ["a", "b"],
          "data": [[1, 2]]
        },
    },
    {
      "name": "数据表名称",
      "response_data":[
          {"a": 1, "b": 2}
      ]
  ]
    调用方式
    //sheetConfig 报表配置 data 数据配置
    spreadSheet.update(sheetConfig,data)
3. 展示端打印功能方案
帮助产品快速获得 按格式套打、按模板打印、按显示打印、按列表一键批量打印、自定义打印、打印模板设置 等能力,节约大量开发时间成本,提高产品体验和竞争力
需要调用XZReportPrint 方法生成打印模板实例 然后调用实例上的方法快速完成功能实现
// 打印模板需要调用 XZReportPrint 方法生成 打印模板实例
const reportPrint = XZReportPrint()
3.1 按模板打印
需要先调用 setTemplate方法设置打印模板 (打印模板可以通过设计器快速生成)然后在调用 print方法
// options 打印模板列表
// [{name:'模板名称',print:sheetConfig}]  name:模板名称, print:对应的是报表配置项
// 设置模板
reportPrint.setTemplate(options)
// data   //打印报表数据 data支持传入二维数组,二维数组为批量数据打印
reportPrint.print(data)

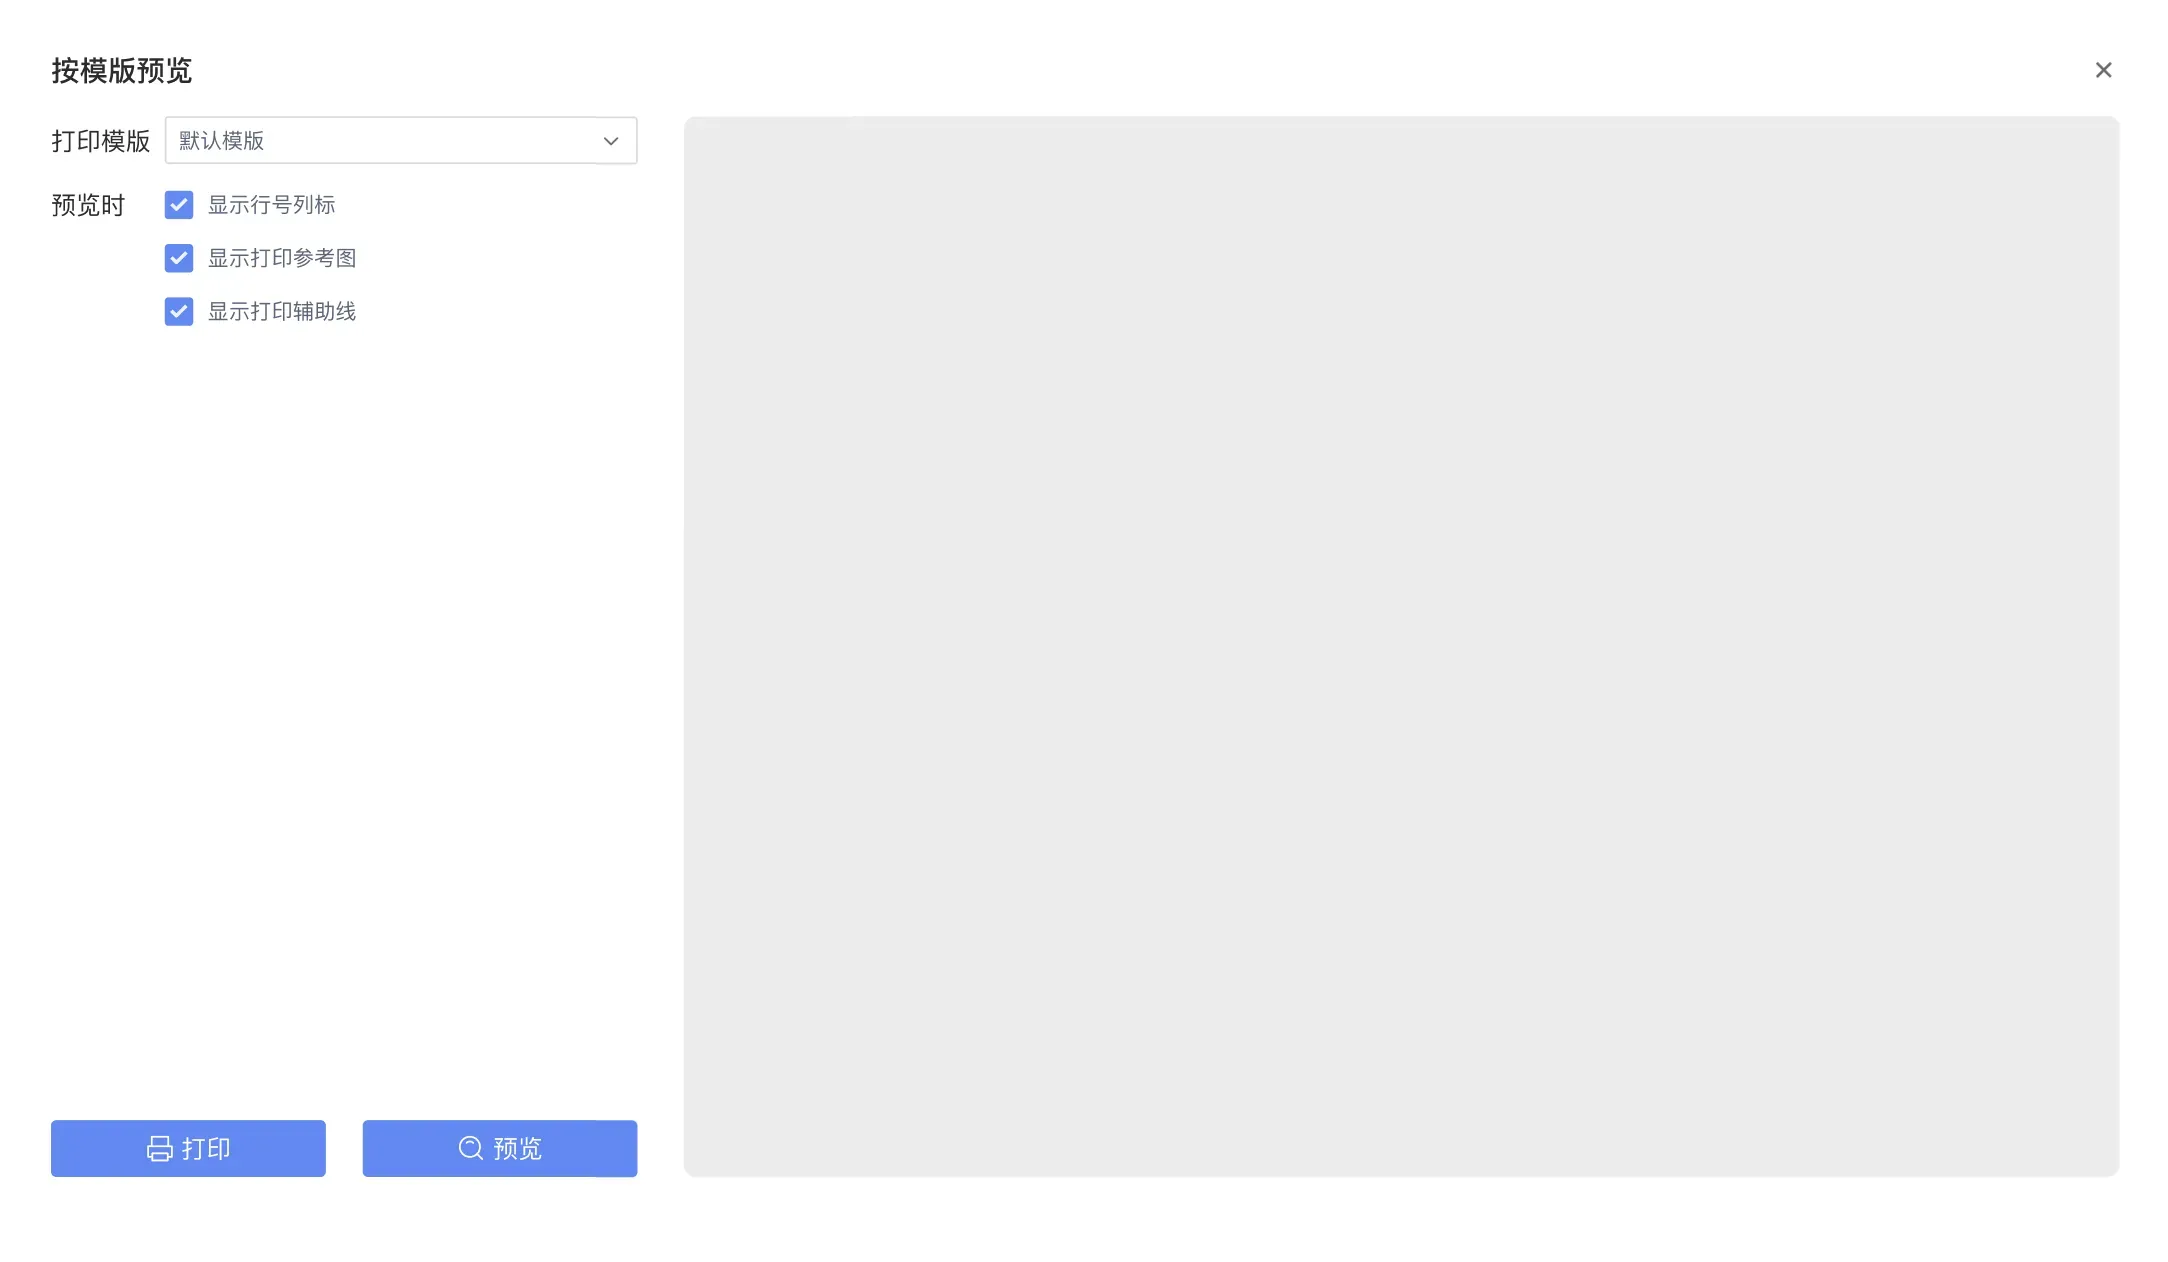
3.2 按模板预览打印
需要先调用 setTemplate方法设置打印模板 (打印模板可以通过设计器快速生成)然后在调用 previewPrint方法
// 参数对应 print方法中的参数
// 效果如下图
// 设置模板
reportPrint.setTemplate(options)
reportPrint.previewPrint(data)
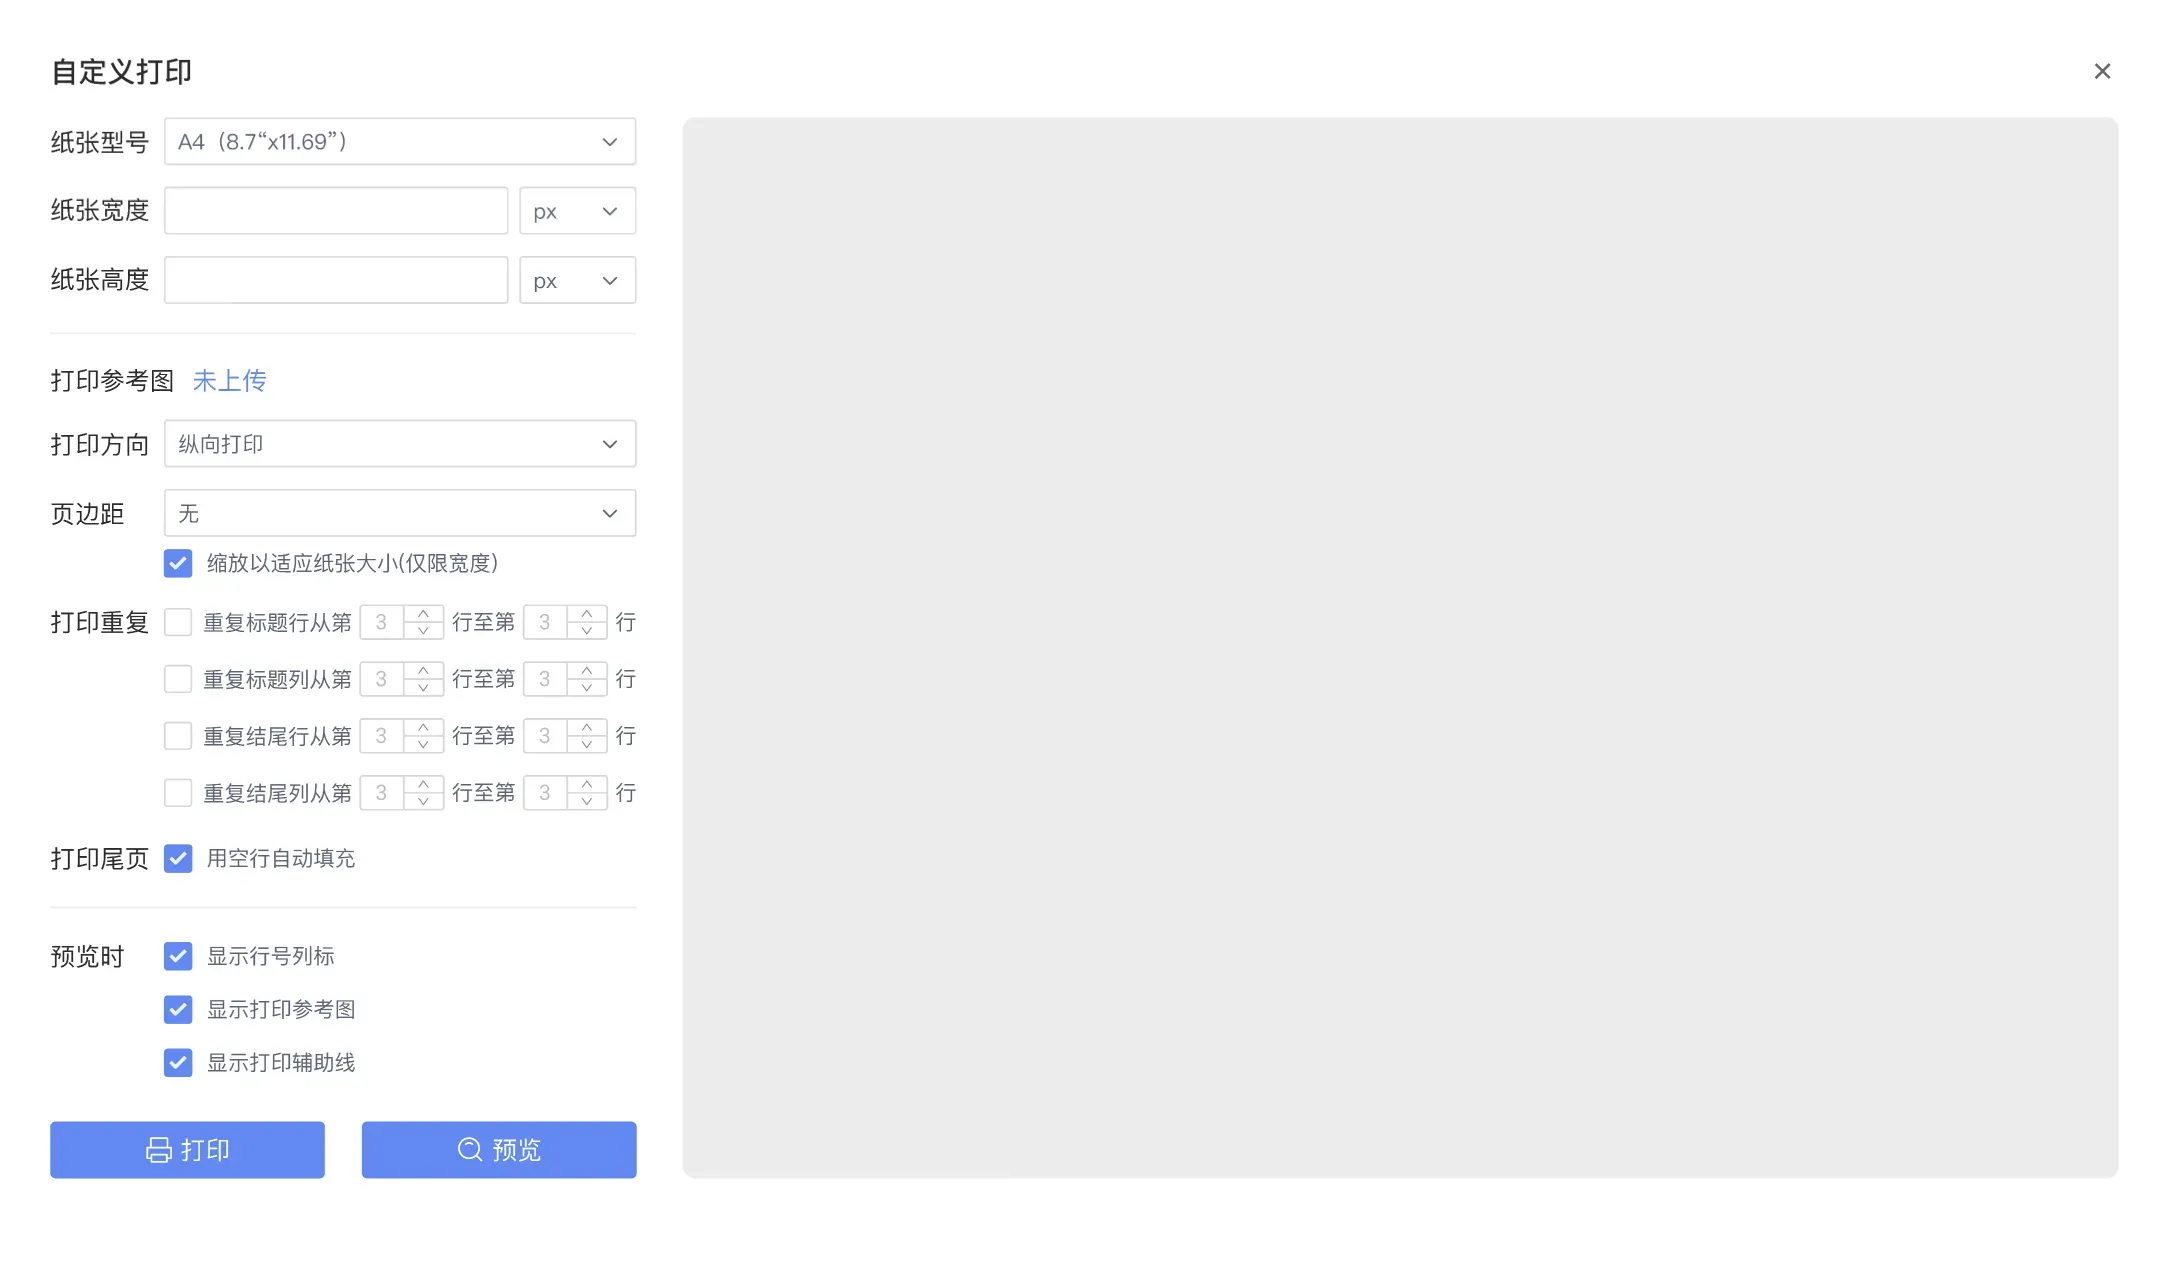
3.3 实现自定义打印
直接调用 customPrint方法即可。
//  data 同print方法中的参数data
// 效果如下图
// template => {name:'模板名称',print:print}
reportPrint.customPrint(data,template)